


Key Takeaways:
The fuel delivery market is expanding steadily, driven by increasing demand for convenience and time-saving solutions.
On-demand fuel delivery services are gaining popularity among businesses and individuals seeking efficient and reliable fueling options.
Fleet-based industries are the primary users, benefiting from reduced downtime and improved operational efficiency through fuel delivery services.
Advanced technologies like GPS tracking and IoT are improving fuel delivery safety, efficiency, and overall service reliability.
Startups and enterprises are investing heavily in scalable fuel delivery apps to capture growing market demand globally.
The fuel delivery market presents strong growth opportunities for new businesses entering this evolving and competitive industry.
The fuel delivery market is growing fast across the world. It is changing how people and businesses access fuel every day.
Instead of waiting at fuel stations, users now prefer on-demand fuel delivery services. This shift is driven by convenience, time savings, and digital adoption.
Recent fuel delivery market statistics show strong growth in both developed and emerging regions. Industries like logistics, construction, and fleet management are leading this demand.
At the same time, startups are using smart technologies to improve service efficiency and safety.
In this blog, you will explore the latest fuel delivery market statistics, including market size, growth trends, key regions, and user behavior. These insights will help you understand where the market is heading and how businesses can benefit from this rising demand.
What are Fuel Delivery Apps?
The fuel delivery apps do allow users to order fuel online for delivery to their location, eliminating the need to visit the gas station. These apps offer a convenient way to refuel vehicles by bringing the fuel directly to the user’s location.
Here, the key features of the fuel delivery apps do include user registration, location-based services, fuel selection and quantity, real-time tracking, order history, and admin dashboard.
The fuel delivery apps do offer convenience, time-saving emergency guidance, along with real-time tracking, multiple payment options, scheduled delivery, and more.
If you are the one trying to build a fuel delivery app, then identifying what’s happening in the current market is crucial.
Still finding reasons to know why evaluating the key market stats is important?
Well, let’s learn about the same in the section below.

Why is Exploring the Fuel Delivery Market Stats Crucial?
If you are wondering what impact the market stats will offer, then this section is for you.
Whether it's about creating a cloud-based fuel delivery app or evaluating the complete cost to build the fuel delivery app, deciding the actual reasons might be difficult.
Because before you learn about” how,” it is important to learn about “why”.
Here are the key reasons to learn.
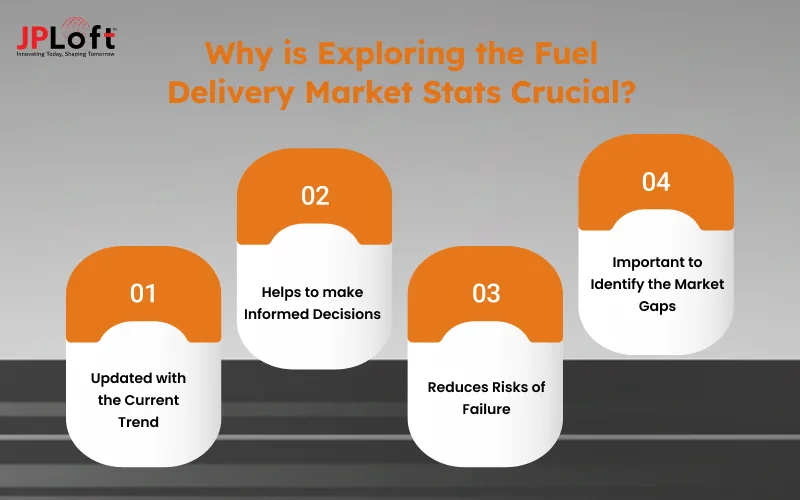
1. Updated with the Current Trend
Learning about the fuel delivery market stats is important as it helps in understanding he current trend in the market about the competitors, what people are performing and expecting in the fuel delivery app market.
2. Helps to make Informed Decisions
The fuel delivery apps help the developers to make informed and strategic decisions related to app development and finalizing the design features as per the present trend. Additionally, through market research, you can find opportunities for optimizing development.
3. Reduces Risks of Failure
Yes, fuel delivery apps fail too. Therefore, learning about the current market will help you minimize the overall failure risks. Through validating the app ideas, evaluating the potential pitfalls, and understanding the user needs, even before investing.
4. Important to Identify the Market Gaps
Another crucial aspect that you need to consider here is identifying the market gap through evaluating the competitive landscape. This will further help you to understand the core needs of the users and then build an app to address the issues of the target audiences.
Hence, considering the above parameters, it's essential to evaluate the key market stats for your fuel delivery app.
Key Fuel Delivery Market Statistics
In this section, we will study and learn about the general fuel delivery market statistics, which will help evaluate the global scale and what’s happening across the world.
Here’s what you need to consider about fuel delivery app stats.
-
The mobile fuel delivery market will grow from USD 5.84 billion in 2025 to USD 11.93 billion by 2035. This market is expected to grow at a CAGR of 7.4%.
- The global fuel delivery market size is expected to reach USD 4.44 billion by 2033 at a strong CAGR of 5.1%.

-
The automotive fuel delivery system market size is further forecasted to increase by USD 26.6 billion, at a CAGR of 5.4% between the years 2024 and 2029.
-
Moreover, the global on-demand fuel delivery market is expected to grow at a compound annual growth rate (CAGR) of 16.4% from 2024 to 2031.
-
The Asia Pacific (APAC) region has captured 38.55% of the complete automotive fuel delivery system market’s 2024 turnover and can outpace all other regions with a 6.92% CAGR to 2030.
-
Gasoline Direct Injection (GDI) accounted for 45.78% of the automotive fuel delivery system market in 2025 and is expected to grow fastest, at a 6.36% CAGR.
After evaluating the above key market statistics, let’s learn about the in-depth global market statistics in detail in the following section.
Region-Wise Fuel Delivery Market Statistics
It's essential to evaluate the region-wise fuel delivery app stats for examining what’s happening in diversified regions across the world.
Signing for fuel delivery app statistics, which are also based on the regions, can help in knowing about country-specific stats.
Here’s what you need to know about the region-wise stats of fuel delivery apps.
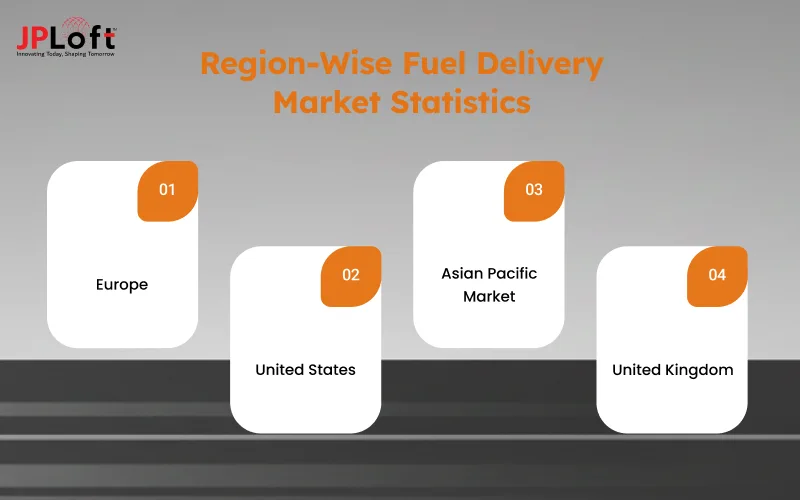
1. Europe
The fuel delivery system market size in Europe is estimated to be USD 1.5 billion in 2024, and is further expected to reach USD 3.2 billion in 2033 at a CAGR of 9.2% from 2026 to 2033.
Along with this, the European Union automotive fuel delivery system has an Uptrend. It is tightly linked with the strict CO2 emission targets, the increasing investments in alternative fuels, and the growing demand for hybrids has increased fuel delivery apps.
2. United States
The U.S mobile fuel delivery system is witnessing rapid growth due to increasing demand for on-demand fuel services, rising fleet operations, and technological advancements.
Additionally, in 2023, the market was valued at approximately USD 5.06 billion and is further projected to reach USD 8.75 billion by 2032.
3. Asian Pacific Market

The Asia-Pacific captured 38.55% of the automotive fuel delivery system market’s 2024 turnover and will outpace all other regions with a 6.92% CAGR to 2030, owing to China’s outsized production, India’s highway expansion, and ASEAN’s localized clusters.
North America remains technology-rich, driven by EPA regulations that mandate 0.035 g/b-hp-hr NOx by 2027. It is one of the most important stats of fuel delivery apps to follow.
4. United Kingdom
The overall UK fuel delivery market will grow from USD 5.84 billion in 2025 to USD 11.93 billion by 2035 at a CAGR of 7.4%.
Here, the UK fuel delivery market is growing due to increasing Urbanization, expanding corporate fleet services, and enhanced usage of fuel delivery apps.
Considering the above diversified regions and an evaluation of fuel delivery market statistics, let’s focus on related apps in the following section.
Top Fuel Delivery Apps and Their Downloads
What are the top fuel delivery apps that most people are following in this dynamic world?
Let’s learn about the examples below.
1. CAFU
CAFU is a leading fuel delivery app in this competitive market and has about 1 million+ + downloads.
A recent community comment on Reddit estimates that CAFU has around 2.3 million total downloads, and assuming about 50% are active users, that suggests approximately 1.15 million active users worldwide.
The number of downloads is increasing, which represents its importance in this competitive market. To develop an app like CAFU, you need to analyze its niche and the reason behind its growth.
2. Booster
Booster Fuel Delivery App is a company that develops and creates an app-based service to deliver and pump gas in office parking lots.
The app serves over 20,000 customers per week across corporate campuses and fleets, including clients like Facebook, Cisco, eBay, and PayPal.
You can create an app like Booster by evaluating its popularity and its strategic steps.
3. EzFill
EzFill is a mobile fuel delivery service that keeps the ride and business fleets without worrying about fuel.
As per the GlobeNewswire, the app estimates around 12,000–13,000 Android installs as of April 2025.
If you want to invest in the EzFill app, then you need to evaluate the cost of creating an app like EzFill in simple steps.
You can learn more about the fuel delivery apps in the table stated below.
|
Rank |
App |
Current public install range* |
Quick note |
|
1 |
CAFU |
1 million + (Google Play) |
Dominant in the UAE; expanding across MENA |
|
2 |
Booster |
100 k + (listed as “1 L+” in Indian notation) (Google Play) |
Corporate fleet focus in the US |
|
3 |
EzFill |
10 k + (iOS) |
Consumer + marine fueling in the US |
|
4 |
FuelBuddy (India) |
≈ 45k total downloads (AppBrain) |
Largest doorstep‑diesel brand in India |
|
5 |
Fuelster |
1 k + (AppBrain) |
Niche LA & Las Vegas service; app now off Play Store |
|
6 |
MyPetrolPump (India) |
5 k + (legacy figure) (youthapps.in) |
Rebranded under FuelBuddy in many cities |
Now, after learning about the details of the fuel delivery apps, let’s evaluate the fuel delivery market stats and demographics in the section below.
Fuel Delivery Market Demographics & Usage
In this section, you will study the age and generations using the fuel delivery apps, along with the income and urbanization, and the geographic trends.
Let’s proceed with the same, below.
1. Age & Generation
Around 49% of users fall into the millennial bracket (roughly ages 26–41 in 2025), making them the largest age group adopting on-demand fuel services.
Across delivery apps in general, younger groups dominate—88% of 18‑34-year-olds regularly use delivery services, compared to under 40% for older generations.
2. Income & Urbancity
Users skew toward high-income urban households. These consumers value convenience and are more willing to pay a premium for fuel deliveries that save time.
They're often professionals or business owners who prioritize efficiency over cost, making them ideal early adopters for app-based fuel services.
Here is the Summary of this section.
|
Demographic Category |
Fuel Delivery App Users |
|
Major Age Group |
49% millennials (largest segment) |
|
Likely Income |
High-income, urban residents |
|
Primary Regions |
U.S., India, China, SE Asia, UAE, Saudi Arabia |
|
Trust Indicators |
Clear tracking, fuel source transparency, drive adoption |
Other Important Fuel Delivery Market Stats
There are always chances that something is missed out, hence we have covered it all for you.
Let’s learn about the crucial fuel delivery market stats in this section in detail.
-
Market size today: The global on‑demand fuel delivery segment was valued at roughly USD 3.5 billion in 2023.
-
Growth forecast (2023–2032): Expected to balloon to about USD 12.7 billion by 2032, reflecting a CAGR of 15.4 %.
-
Another estimate (2025–2035): The mobile fuel delivery market is forecast to rise from USD 5.84 billion in 2025 to USD 11.93 billion by 2035, delivering a 7.4 % CAGR.
-
Alternate sizing for platforms/system: The mobile fuel delivery system market stood at USD 5.06 billion in 2024, and is expected to reach USD 8.75 billion by 2032 at a 7.1 % CAGR.
-
Another projection (2024–2031): Rising from USD 5.4 billion in 2024 to around USD 8.9 billion by 2031, at a 7.3 % CAGR.
If you are the one wants to implement the fuel delivery app stats into your app and wants to connect with the experts, then partnering with the leading team will help.
Fuel Your App Vision – Build It Right with JPLoft
After learning about the fuel delivery app, it is crucial to implement these stats wisely and build your next fuel delivery app with confidence.
You can connect with JPLoft. Our team knows well the use of current market stats and how to implement them in your favour. We are ready to evaluate your dream and then enhance it to achieve the possible success.
We are the leading Fuel Delivery App Development Company, focused on providing you with the app with honesty, integrity, and sincerity. Our team understands the value of your dream and then puts it ahead of all.
The experts at JPLoft can conduct the market study for your app and then implement it successfully after examining the gap that exists.

Conclusion
The fuel delivery app market isn’t just evolving, it’s exploding with potential.
With forecasts showing growth from $5.84 billion to nearly $12 billion by 2035 and millions already using apps like CAFU and Booster, the opportunity is wide open.
Key demographics like high-income millennials and urban professionals are driving demand globally from the U.S. to Asia and the UAE.
For anyone looking to enter this space, understanding these market trends isn’t optional; it’s essential. Use these insights to shape your product, reduce risk, and move ahead with confidence.
FAQs
As of 2025, the fuel delivery app market is valued at around $5.84 billion, with forecasts showing it could reach $11.93 billion by 2035.
Millennials (ages 26–41) make up about 49% of users, especially high-income urban professionals who value convenience and time savings.
Market stats help you understand current trends, identify user demands, reduce risk, and spot gaps your app can fill effectively.
The Asia-Pacific region leads with 38.55% of the market, followed by North America, the UAE, and other parts of the Middle East.
Top apps include CAFU (1M+ downloads), Booster (100k+ downloads), and EzFill (10k+ downloads) each dominating their respective regions.

Savannah is a passionate tech enthusiast with a sharp understanding of client needs across diverse digital domains. With expertise spanning financial platforms, on-demand solutions, and emerging technologies, she brings a unique blend of analytical insight and interpersonal skills, helping businesses decode complexities and make informed decisions in today's rapidly evolving digital world.


Share this blog